The first year in numbers
Review the first year of the blog in numbers. How it performed on Google analytics and Google Search console. Let's try to SEO it!

A year ago I published the first post on this blog on OAuth. That was a topic back then I was working a lot with at Wise. One year later in this post, I want to show you some numbers about the blog and kick off an experiment.
The numbers
When I started I did not have anything in mind about how many posts I wanted to write, on what schedule, or how many views I will be satisfied with. The goal was to have a public place where I could post the ideas or methods that fascinate me or I find useful. As time passed, I was somewhat surprised by the clicks some of my posts got organically. Let's see some interesting numbers from Google Analytics and Search Console.
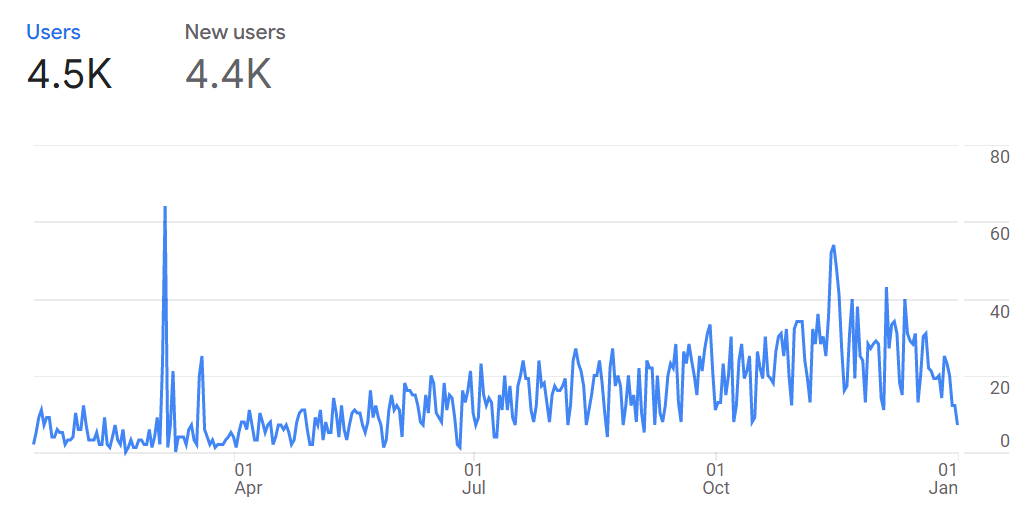
On the first graph, one can see the number of daily visitors the site got. I don't have any comparisons whether this is good or bad, but I like the trend. By the end of the year in December, there is a dip. It could be caused by the holidays as people are not focusing work-related blogs as much. We will see if it comes back soon as the year starts.
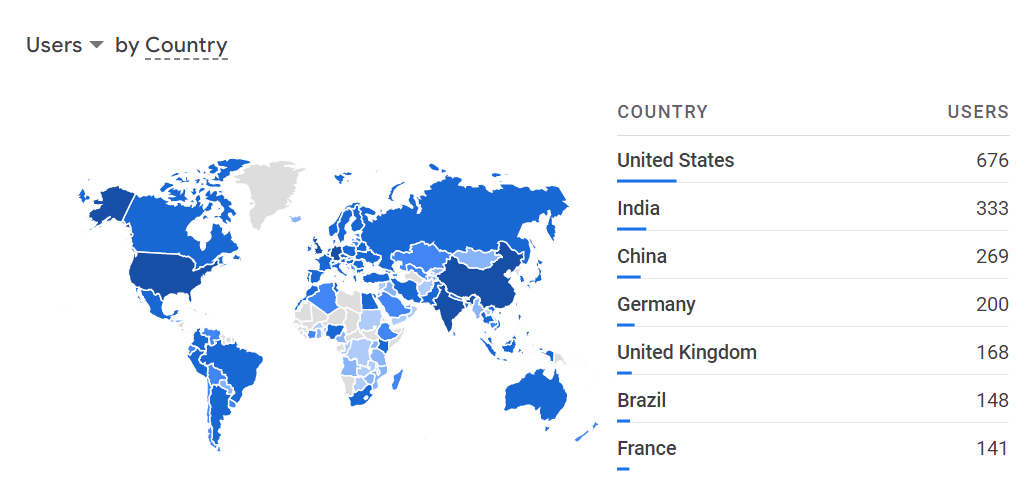
I got views from many countries, I never expected to be this widely found around the world.
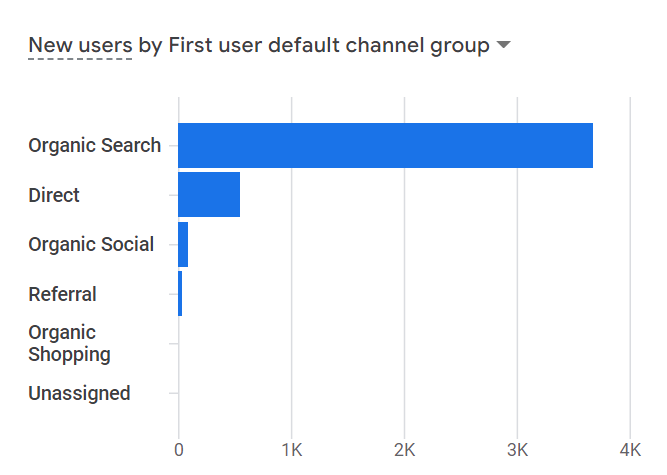
As I mentioned all the clicks are completely organic. I never paid for any ads or such. The only advertising I did was that I posted about my new writings on LinkedIn and sometimes on Twitter. Search is by far the most impactful source of views.
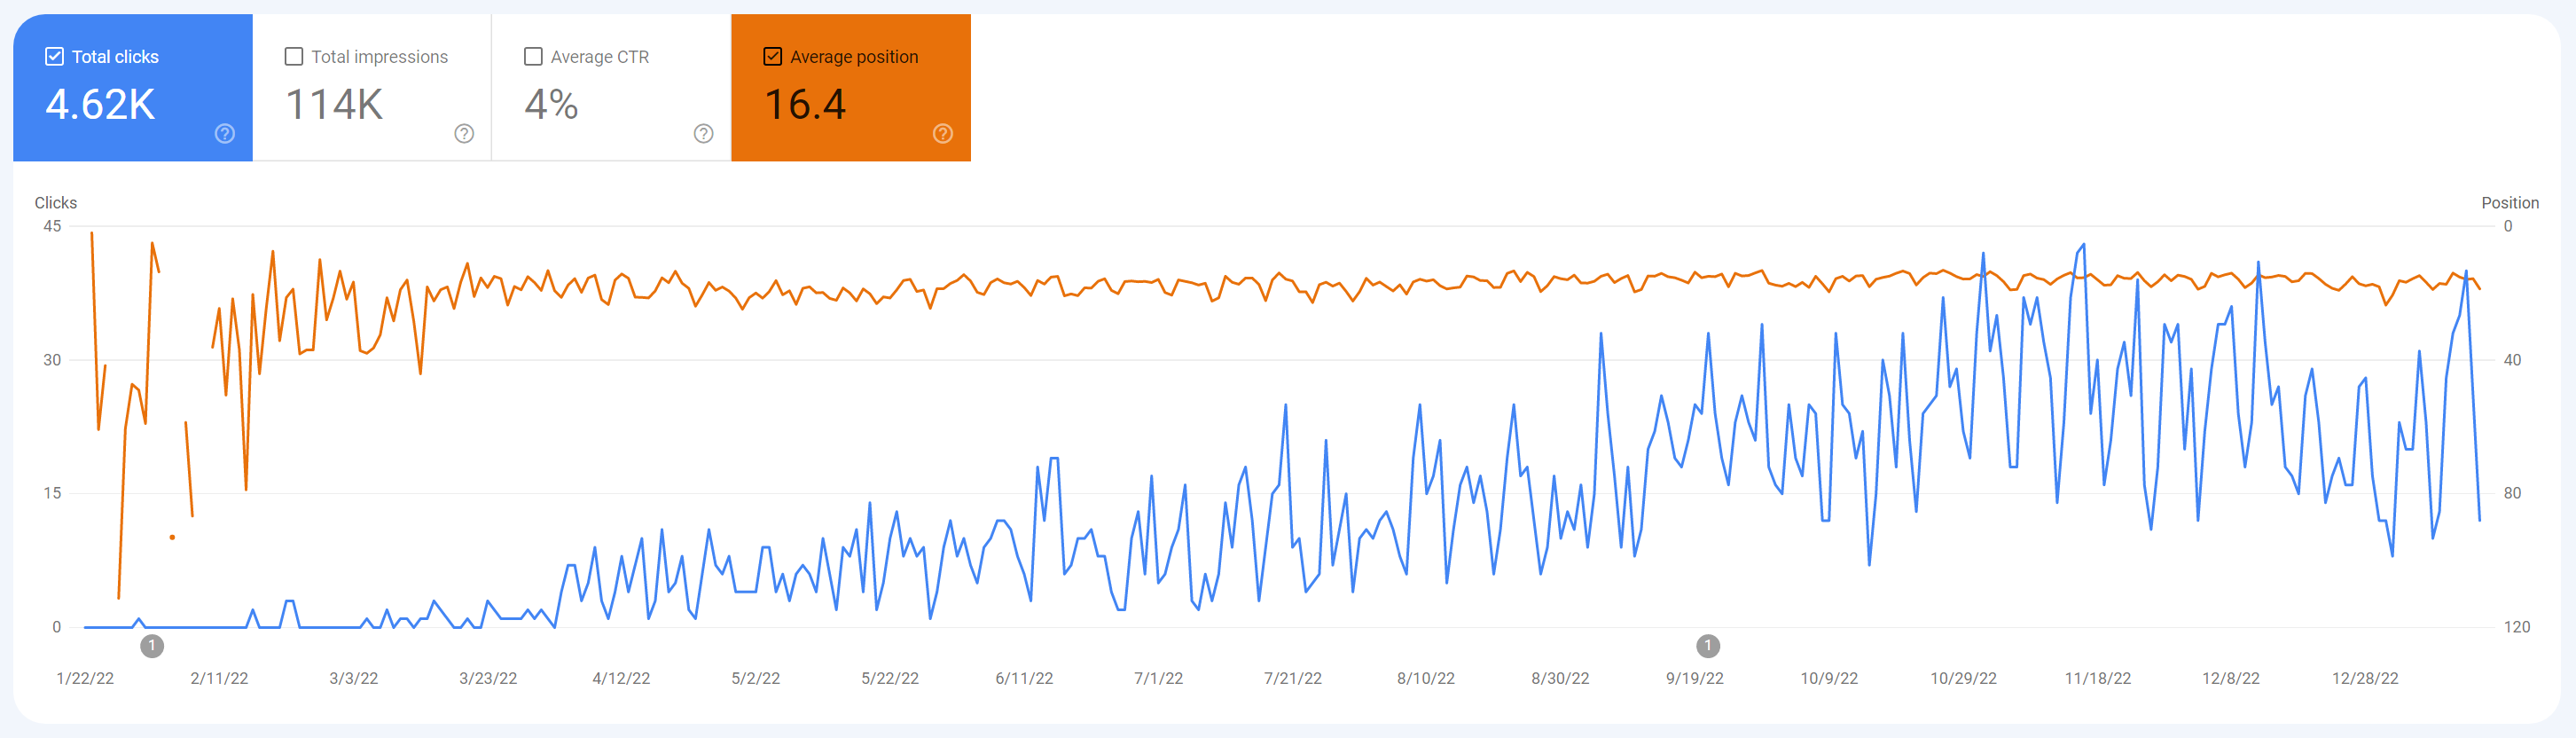
This graph is from Google Search Console and it shows a similar trend to the views chart. In blue, an increasing number of clicks with a dip at the end of the year. The orange line is the average Google search position for my pages. It improved from around the 20th to the 16th which is not much, still not the first page most of the time, but hey, steady progress.
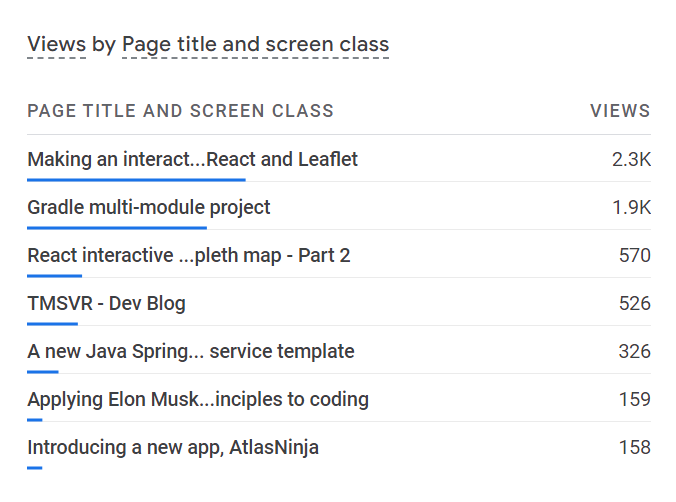
Another interesting piece of info is what pages were the most interesting to you. I think it is pretty clear that the biggest hit was the React Map project that became AtlasNinja.com the second one being an example of multi-module Gradle projects which is a tricky subject. The rest was not too exceptional.
The last piece of numeric information is that the average engagement time is about 1 minute. It is a bit little to fully read an average article here, but better than just clicking on the link and leaving immediately. It also gives me a good baseline to try to improve on.
The Experiment: SEO it!
Whenever I wrote and posted an article, I tried to make it search engine friendly to my best knowledge which I have to say is not much. I did not read up on the topic or used any tools to analyze keywords and optimize the content. I did ask an ex-colleague who is an expert on the topic and she had some suggestions on how to improve things. As she said with some time invested I should be able to make some visible improvements on the numbers without spending any money.
So the experiment I want to do is that from now on I'm going to utilize SEO tools and tutorials and anything I can get my hands on. I'll try all these out and see what I can achieve. I will also optimize the older posts and write new ones according to the suggestions I find. I also try to be a bit more systematic with posting. Last year I wrote a lot in the first half and barely anything in the second which is not good.
I'm planning to write a similar article in 3 or 6 months to check the results. If you don't want to miss it, I suggest subscribing here or in the bottom right corner. It is free, you get an email for each article I post, and also makes you able to comment on the blog to give me feedback, point out if I'm wrong or ask questions!