Introducing a new app, AtlasNinja
AtlasNinja is a new app providing modern and interactive map visuals for data about countries.
In the past month I have been sharpening my React skill and that was for a reason. Me and my buddy were working on a new app called AtlasNinja which is now live! In this post I'll introduce it and our future plans with it.
Check it out here: AtlasNinja.com
Our goals
Our world got really small with the widespread adoption of commercial jet aviation. We can travel to anywhere in the world within hours. There are 195 countries around the globe many of which most of us know very little about. AtlasNinja's goal is to collect, aggregate and help visualize data about the countries.
There are many sites that has this data but usually it is either in a table, or on a static pre-rendered map. If you want to do some exploration or comparison you will have to Google for the data source, then figure out how to understand the various display formats used. Our goal is to provide a modern unified experience for all.
We hope that this data can help many. People trying to learn more about the world, students preparing for their geography or history classes, journalists collecting information for an article and so on.
Our principles
It is very important for us to be reliable. We always check and try to double check our data and use well respected sources.
We also want to be up to date, so we regularly refresh all our data.
We want to provide a modern and user friendly service, so we continuously improve our tech and try to make it work on as many devices as possible with good performance.
Features
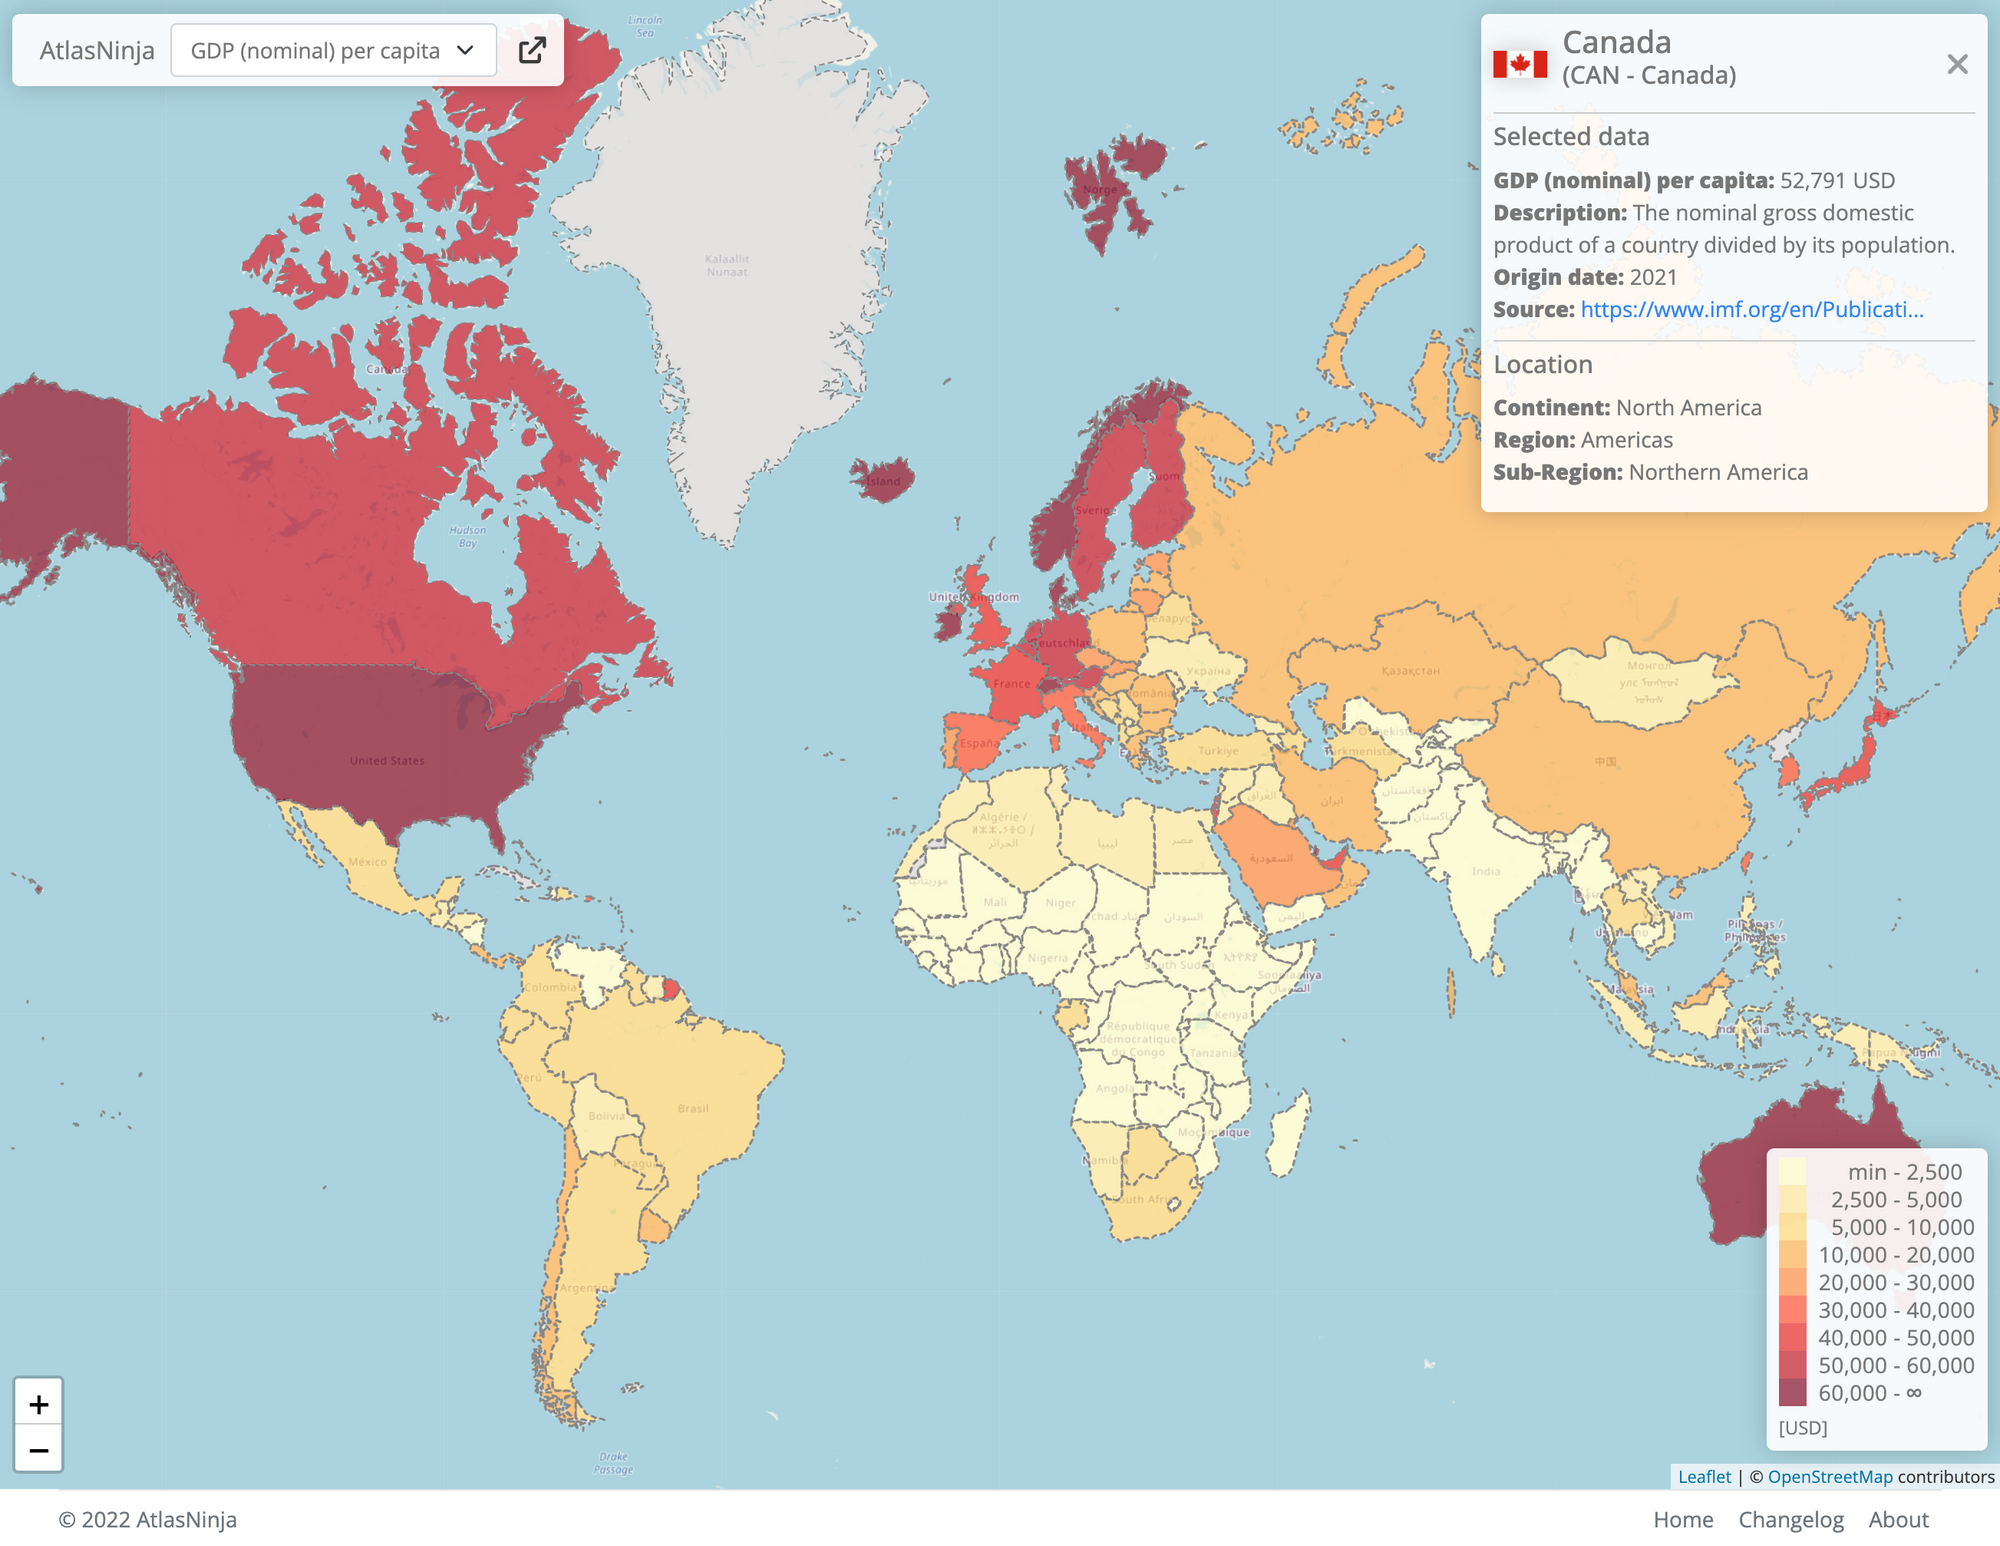
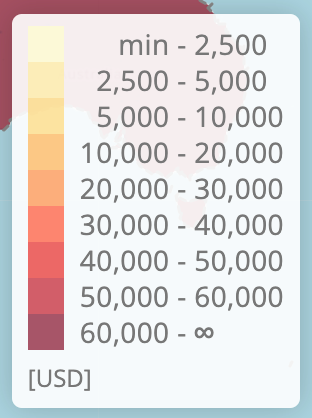
The goals we set for the MVP are what you can use right now. The main thing is a choropleth map displaying the information. We use multiple color sets with varying size to maximize color difference between steps. The colors are also colorblind friendly.
In the top left corner there is a data scope selector that you can use to select the dataset to display.
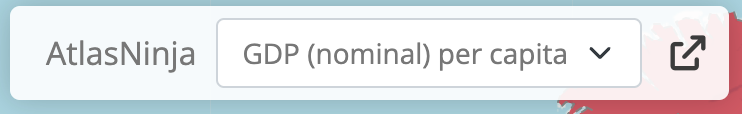
This control also has a share button that copies a shareable link to your clipboard. This link contains map position with zoom, selected data scope and selected country. You can easily show the exact same view to your friends.
On hover over a country a small tooltip shows the country name and selected value. The legend also highlights the range this hovered value falls into.
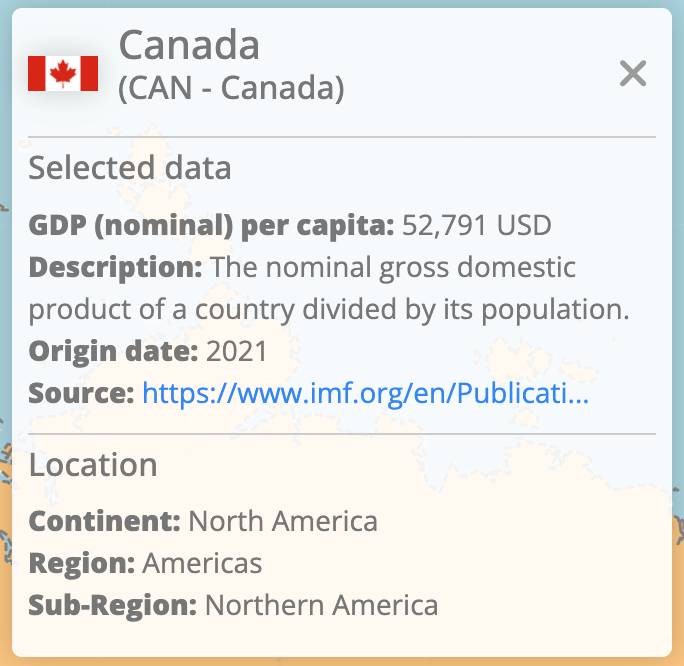
If you click a country an infobox will open in the top right corner. This displays the country's official and short name together with its ISO_A3 designation, flag, the value, a description what this data actually measures, information on the data source and origin date and finally location of the country in the means of continent and region.
What to expect in the future
We plan to continuously improve the service multiple times a month. These improvements will include new features as well as new data. On the website we keep track of the new stuff on the Changelog page. In our short to mid term plans there are:
- Logical grouping of items in the data scope selector
- The possibility to select multiple countries and see aggregate values
- Country and country group comparison
- Handling historical data, displaying changes
If you are interested in the tech behind AtlasNinja, check out my previous articles about React and Leaflet.
 Imre TömösváriImre Tömösvári