React interactive choropleth map - Part 2
Adding an interactive tooltip and fixing the performance of a react-leaflet based choropleth map can be quite a challenge.
I had a post a few weeks back about my first experiences with React, creating an interactive choropleth map of the world. There are new features, bugs are fixed and I learned a lot about how React works and how can I improve performance. Let's jump right in!
Fixing the issues
One major issue I had was that the InfoBox component showing details of the selected country was not clickable. I could not put a button or link there, if I clicked it was like I have clicked the map layer, it was also impossible to select its text. The problem was that all the events were propagated to layers below that. I could have played around with it but it was easier to just add a small library called react-leaflet-custom-control that did this for me. My only issue with this is that the repo was not updated recently, but works fine. Maybe I'll change it later for another one, or just do it myself, but for the time it works perfectly.
The old code of the infobox component:
return (
    <div className="info leaflet-top leaflet-right">
        {infoBox}
    </div>
)
The new code:
return (
    <Control position='topright'>
        {infoBox}
    </Control>
)
Besides introducing this new component I had to play a bit with the CSS too, to have the same looks.
By the way, if you look into the library (it is very simple, 1-2 files only), you can see the calls DomEvent.disableClickPropagation(container) preventing event propagation.
Tips on choropleth maps
It is not as easy to create a colored map as it may seem. You want to have many colors so you can display something in high detail and resolution but the thing is that it is not so easy to come up with a color scale that
- Tells your story -> shows a scale difference for example, like getting darker and darker as the value gets larger. Or in some cases, you may want to display 2 extremes and the transition between those, or some enum values like the wall plug types used in each country. All these require different approaches and different kinds of colors.
- Has enough steps -> so you can have the resolution you want and our human eyes and our displays are capable of distinguishing them from each other.
I'm not a color scientist or graphic designer, but luckily I don't have to be. There are excellent materials on the internet on the topic. Datawrapper has a blog post about colors and other things to consider. Highly recommended read if you want to build something similar.
 lisacmuth
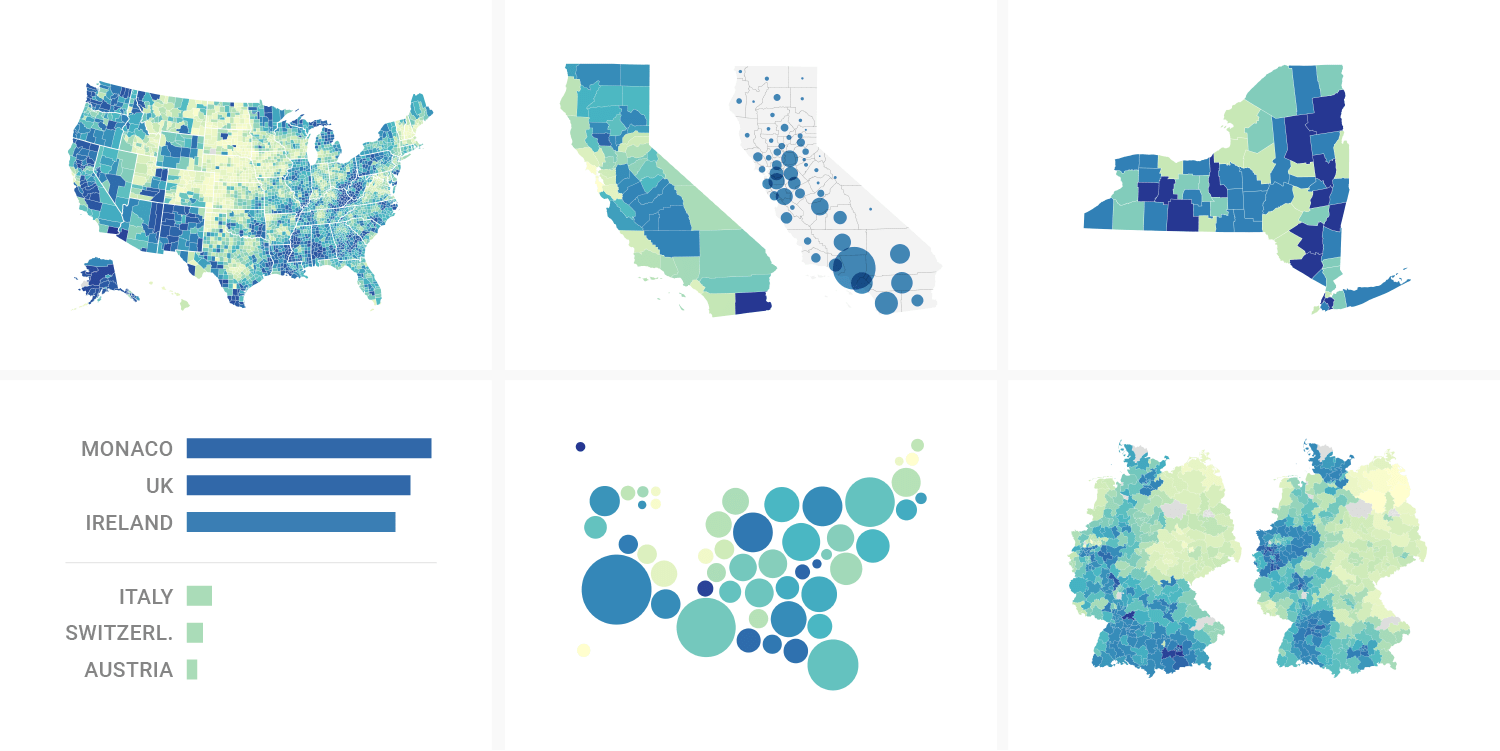
Based on this I decided to limit colors to 9 and still try to use less around 6 max. On the topic of what colors there is also awesome help in the post. there is a link to this website, that you can use to generate color scales for your needs.
New features
Besides fixing things I have added new features too. The colors are nicer, we have a cool legend, and also a tooltip!
Refactoring colors
I have talked about colors a bit earlier. In the spirit of making the map nice, I have 2 color scales now 8 and 9 long. I also modified my 2 dataScopes so the scales have 7 and 8 items. Why? If my scale has 3 points I need 4 colors to cover everything.
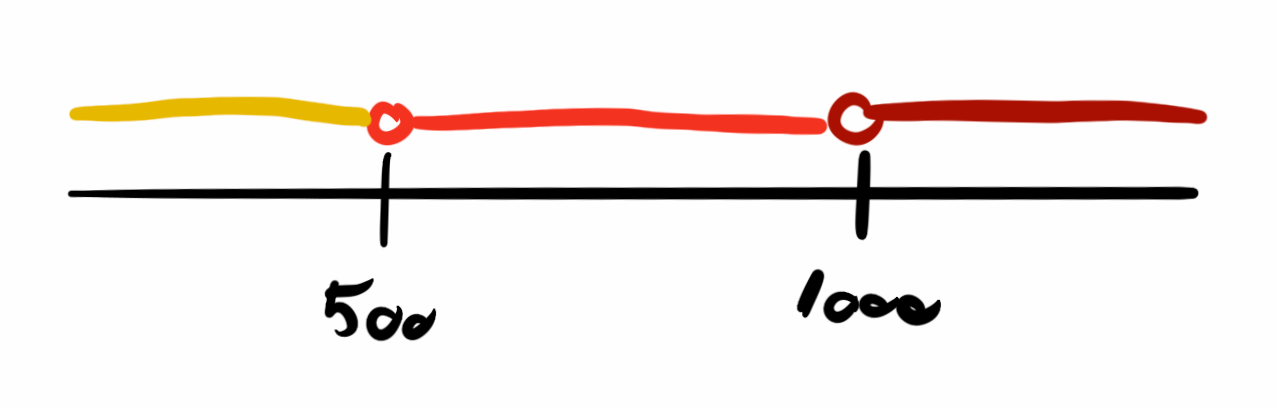
The getColor function got a bit smarter (and refactored into a separate util file) and now returns colors based on the scale length. This way I can utilize the whole range of the appropriately sized color array. The min and max colors will be the first and last colors in the ranges all the time, this way maximizing the differences between the shades.
How not to get lost
So earlier a user would be able to pan the map as much as they want and could lose my polygons on it as the map was an infinite repeat of itself in the horizontal direction. To prevent this leaflet and react-leaflet provides a bunch of options on the MapContainer.
<MapContainer center={[40, 0]}
                    zoomControl={false}
                    zoom={2.5}
                    maxZoom={8}
                    minZoom={2}
                    zoomSnap={0.5}
                    zoomDelta={0.5}
                    wheelPxPerZoomLevel={120}
                    maxBoundsViscosity={0.5}
maxBounds={L.latLngBounds(new L.LatLng(85, -210), new L.LatLng(-85, 210))}></MapContainer>- center - sets the default center point for the map
- zoomControl - whether a +/- zoom control is present
- zoom - default zoom level
- minZoom/maxZoom - min and max zoom levels
- zoomSnap - zooming should snap to steps this large
- zoomDelta - a single zoom click moves this much
- wheelPxPerZoomLevel - mouse scroll sensitivity for zooming
- mouseBoundsViscosity - how strictly will the map pan back to the given bounds if dragged out by the mouse
- maxBounds - the bounds that our view should not leave
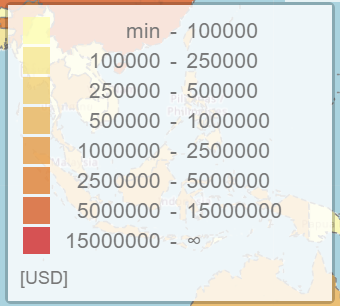
Interactive legend
I have recently seen this website and I liked the interactive legend the map has. As you move the mouse over the map, the relevant legend item is highlighted. It also works the other way, by hovering on the legend, the map highlights the regions with that color. I like this approach, I think it makes data easier to understand and also looks cool, so I have recreated it (part of it at least).
I wanted to create half of this feature where the legend itself is highlighted according to your mouse position over the map. I already have a state variable in the main component to keep track of the country with the mouse over it called hoveredCountry. I need the exact same information in the legend too, so I created a component for the Legend, and passed this state variable to it. What the legend also has to know is the ranges in the currently selected data (GDP or population) and the colors, so those are parameters of it too.
<MapContainer ...>
	...
	<Legend scope={dataScope} colors={colors} hoveredCountry={hoveredCountry} />
</MapContainer>
The component itself has a bit of complex logic because I had to calculate where the currently selected value falls on the range defined for the given dataset. I build up the HTML table row by row in an iteration, if the current row is the "selected" one, I use a different class to make it highlighted. The design is a bit all over the place or better say nonexistent. Making everything look nice is a separate post, now I only concentrated on making things work.
The full code can be found on GitHub if you are interested in the details, link at the end!
Tooltip
And this is where the story gets interesting. React-leaflet has a straightforward way of adding a tooltip to the map. Based on the documentation you just have to do something like this
<GeoJSON data={countries} style={style} onEachFeature={onEachFeature}>
<Tooltip sticky>
{dataScope.name}: {hoveredCountry.feature.properties[dataScope.key]}
</Tooltip>
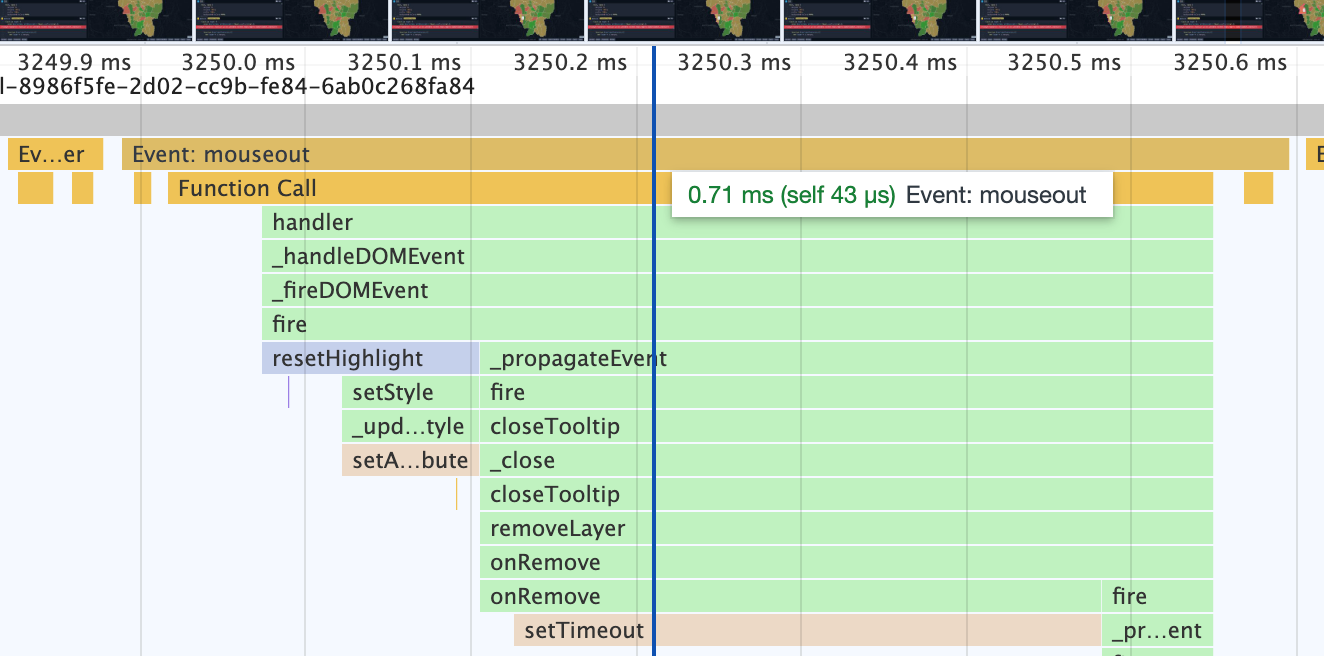
</GeoJSON>And this works fine however, there is an issue. If you are using bigger maps, like the world, you will notice your computer's fans spinning up while hovering your mouse over the countries. This is because using the tooltip like this causes re-renders of the GeoJSON component. This will happen on each hover event mouseover and mouseout too. So if you move your mouse from one country to another one, all the countries will be re-rendered twice. It's also easy to check, just put a console.log() in your style method, and on every hover event, it will be called for each feature you have! This can be easily seen on the Chrome profiler too.
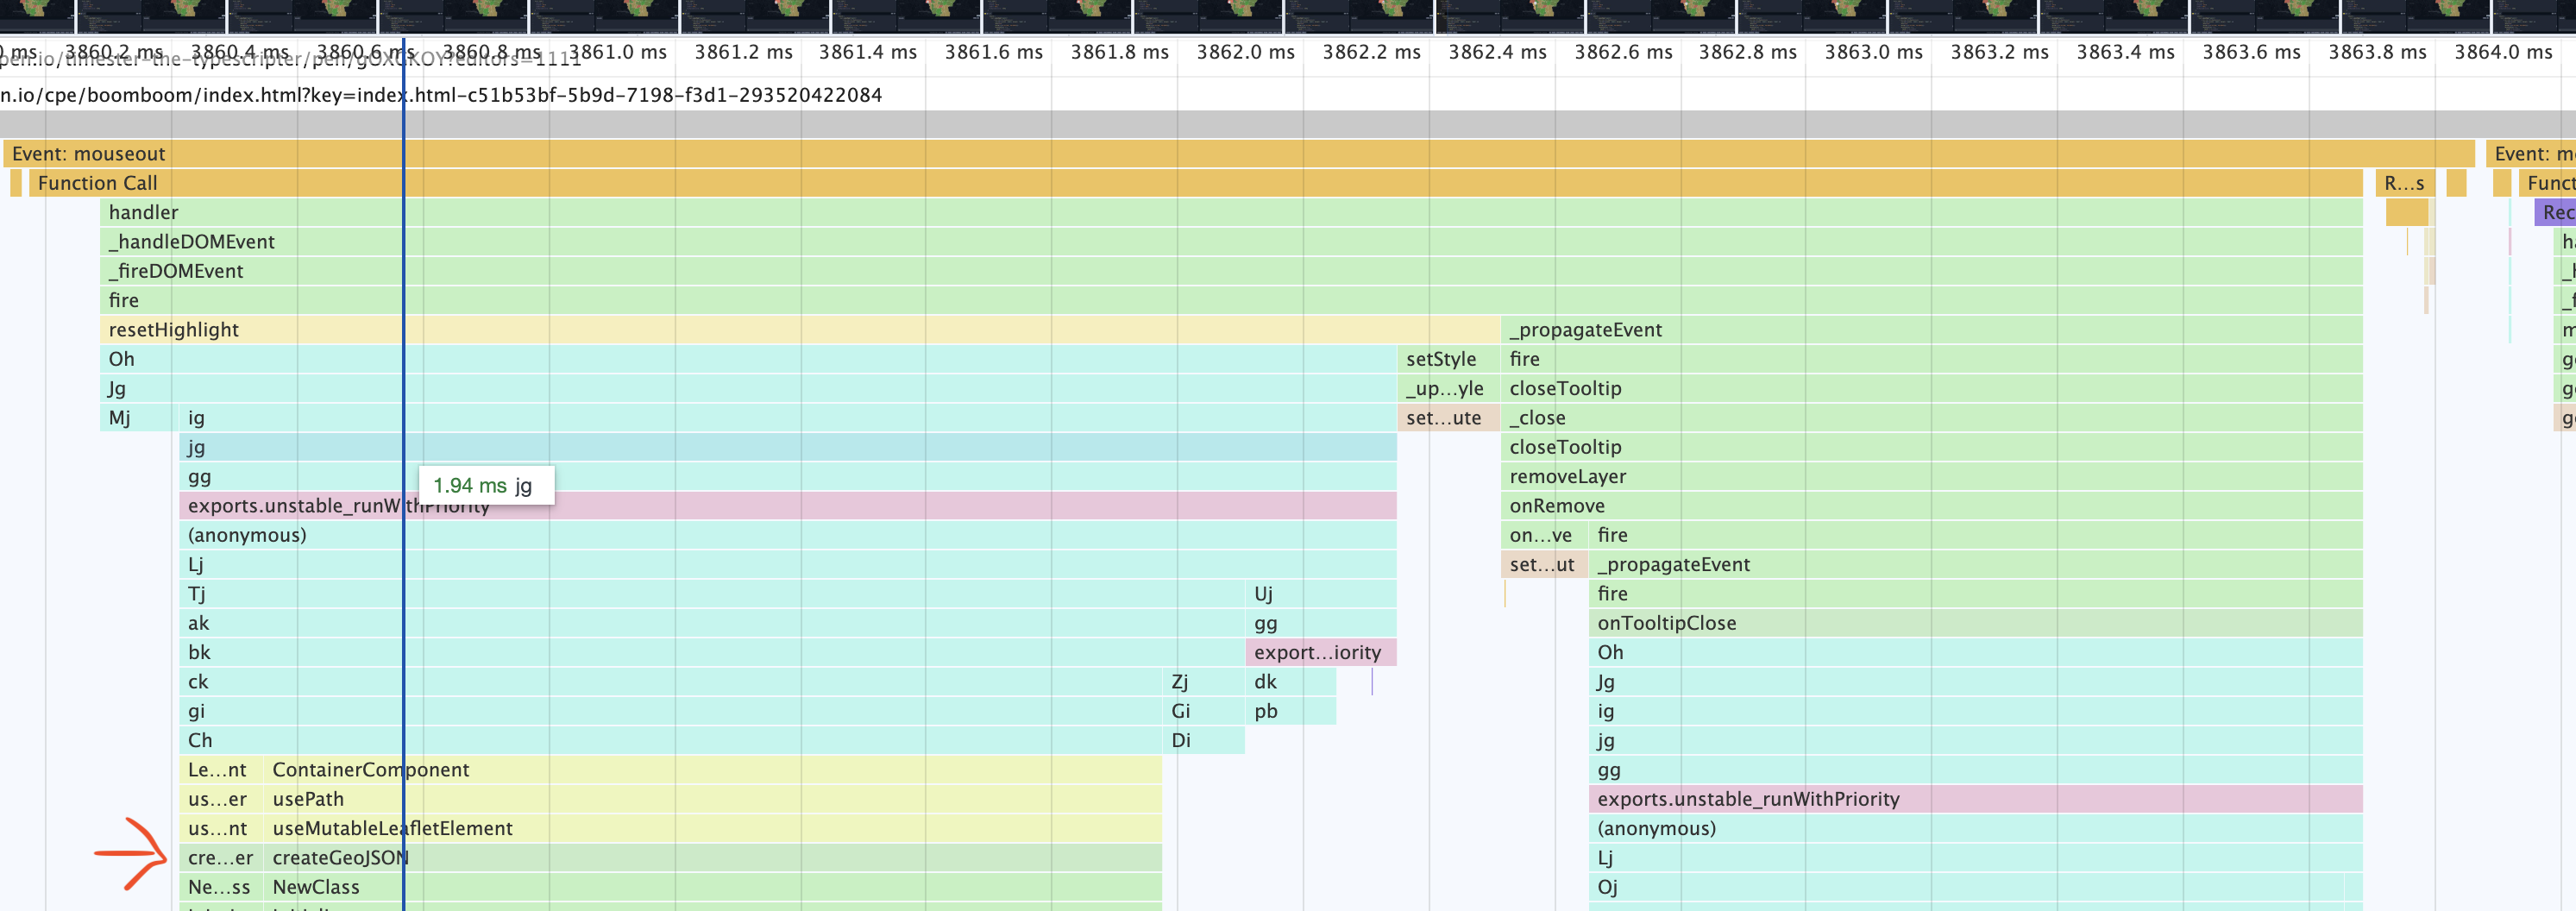
This is because the mouse hover events change the hoveredCountry state variable causing the whole component and its children to re-render. Commenting out the state changes from hover events solves this performance issue.
const highlightFeature = (e) => {
	let layer = e.target;
	// setHoveredCountry(layer.feature.properties); <- causing re-renders
}
But this obviously will break our tooltip and other features relying on that. I spent a few days trying to figure this one out and finally got help from the r/ReactJs community on Reddit. To solve the issue I changed the way how I created the Tooltip. It was important not to add it as a child element to GeoJSON because this way I could not memoize the GeoJSON component, preventing it to be re-rendered on the main component's state changes. The idea was that I had to find a way so I can use React's useMemo on the GeoJSON component, and useCallback on its dependencies the style and onEachFeature functions, caching everything, preventing re-renders.
useMemo(), useCallback()
A nice way in React to prevent a component from rendering when it did not change is memoizing - basically caching - it. The useMemo() function can be used to cache objects while the useCallback() is for functions. Both have a second parameter which is an array of dependencies. State variables for example used inside these blocks must be given as a dependency and the cached block will be re-rendered or calculated once a dependency in its dependencies array changes.
I moved the tooltip setup to the onEachFeature function. This way it is not as elegant, but not too bad, and most importantly it is no longer a child of GeoJSON!
const onEachFeature = (feature, layer) => {
	layer.bindTooltip(`<div>${dataScope.name}: ${feature.properties[dataScope.key]}</div>`, {sticky: true});
    ...
As a next step, I wrapped style and onEachFeature into useCallback() and the GeoJSON component into useMemo() and this did the trick!
The performance measurements showed a huge improvement after this. Both the profiler and the "put a console.log into your functions" method showed that the re-renders are gone.
However, there was still another issue. The plot thickens!
After the refactor I noticed that the performance got good again, but the tooltip was no longer following the change of the data from population to GDP or the other way around. The dataScope is a dependency of the onEachFeature function inside the useCallback so it should update itself when it is changed. After a couple of hours of investigation, I figured that the onEachfeature is getting called on data change, but the layer set it gets as a parameter seems to be a completely new one, as the layers don't have tooltips while they should have the previous ones. Whatever I do with these layers, adding new tooltips or removing them entirely does not affect the drawn result. It is like a completely separate set of layers that get discarded when the function returns. The only solution I could come up with is a check on a reference for the GeoJSON component. If it already exists then it is not the first run of the onEachFeature function, I will grab the layers from the map reference and modify those. If the map is nonexistent, then this is the initial drawing, I'll do what I did til now in this function.
const onEachFeature = useCallback((feature, layer) => {
	if (geoMap.current) {
		const current = geoMap.current.getLayers().find(e => e.feature.properties.iso_a3 === feature.properties.iso_a3);

		current.setTooltipContent(`<div><span>${dataScope.name}</span>: ${feature.properties[dataScope.key]}</div>`);
	} else {
    	layer.bindTooltip(`<div><span>${dataScope.name}</span>: ${feature.properties[dataScope.key]}</div>`, { sticky: true });

		layer.on({
			mouseover: highlightFeature,
			mouseout: resetHighlight,
			click: () => setSelectedCountry(feature.properties)
		});
	}
}, [dataScope])
It works this way, not the nicest and not the most efficient, but since it won't ruin the mouse hover performance it is ok by me. I don't know why it works like this but if I figure it out I will update this post with the info.
So much work for this simple feature, but it is worth it.
Finishing thoughts
This is the second post on my journey on learning React and frontend development in general. I have to say it is highly motivating that the work you do is visible, you don't only get a few green checkmarks when the tests run ok like in a backend role, but you can see what you did, click it, play with it. It's just cool.
The code for this version can be found on my GitHub.
There are some bigger things in the making related to maps, that these articles are an offspring of. Stay tuned for updates very soon!